Dashboard
The dashboard is Pankha Fan Control’s home screen - the Systems Monitor tab. Every machine running an agent appears here as a live card, and everything about it (sensors, fans, settings, calibration) is managed from this one place. This page is a tour of the screen, top to bottom, including the sensor tools that live on each card.
Header and Navigation
Section titled “Header and Navigation”
The title bar holds the global controls:
- Connection status: “Live / Real-time” while the dashboard receives updates; if the connection drops, a reconnect button appears.
- System Responsiveness (CPU Load): how often the server recalculates fan speeds, from Real-time (500ms) to Very Slow (10s). Faster means snappier fan reactions at the cost of a little more server CPU.
- Theme toggle: switch between dark and light mode.
- Emergency Stop: sets every fan on every system to maximum speed, after a confirmation prompt. Use it if something is overheating and you want cooling now, no questions asked.
Below the title bar are the four tabs: Systems Monitor (this page), Fan Profiles (Fan Profiles & Logic), Deployment (Deployment Center), and Settings (Settings).
Overview Stats
Section titled “Overview Stats”The stat cards summarize your whole fleet at a glance: Total Systems, Online, Offline, Sensors, Fans, Avg Temp, and Highest Temp. An Errors card appears only when an agent is reporting a problem. Temperatures are colored by your own thresholds (set in Settings).
If your license tier has a system limit, Total Systems shows it as used/allowed - hovering explains your tier, and systems over the limit run in view-only mode.
System Cards
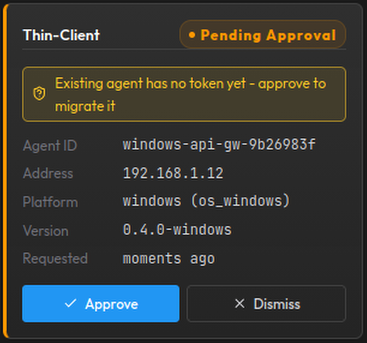
Section titled “System Cards”Each agent is one card. A machine waiting to join the fleet shows an amber Pending Approval card instead - it lists the agent’s ID, address, platform, and version so you can check it’s really yours, with Approve (or Approve & Update for older versions) and Dismiss buttons. See Deployment Center for how approval works.
Approved agents get the full card:
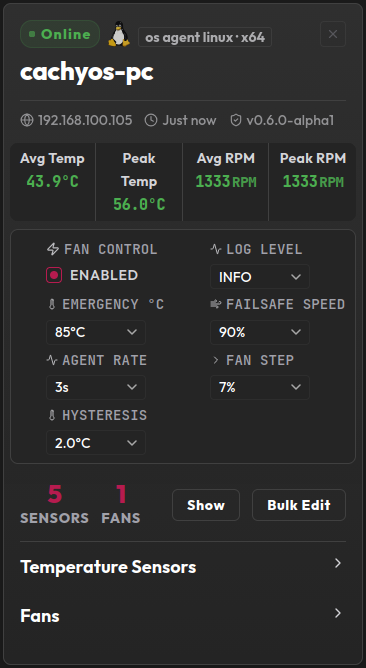
Header row
- Status badge:
online,offline,error, orupdating(mid self-update, reconnects on its own) - hovering an error badge shows the reason reported by the agent. Anunsecuredbadge means the agent runs without an auth token - update it to secure it. - Platform icon: Linux, Windows, or the server vendor’s logo for IPMI agents, with an architecture tag.
- Name: click it to rename the system - the new name is saved centrally.
- X button: removes the system from the dashboard.
Meta and stats: IP address, last seen, and agent version, then live Avg/Peak Temp and Avg/Peak RPM for the whole machine. Hidden sensors are excluded from these numbers.
Configuration controls (shown while the system is online): Fan Control on/off, Log Level, Emergency temperature, Failsafe Speed, Agent Rate, Fan Step, and Hysteresis - each a dropdown with a plain-language tooltip. These are the per-agent settings; see Advanced Settings for what each one does.
Sensors / Fans counters with two buttons:
- Show / Hide: reveals hidden sensors and fans so you can unhide them.
- Bulk Edit: apply a fan profile and/or control sensor to many fans in one action (see Fan Profiles & Logic).
Temperature Sensors
Section titled “Temperature Sensors”Expanding the Temperature Sensors section lists every sensor, grouped by the hardware chip that reports it:
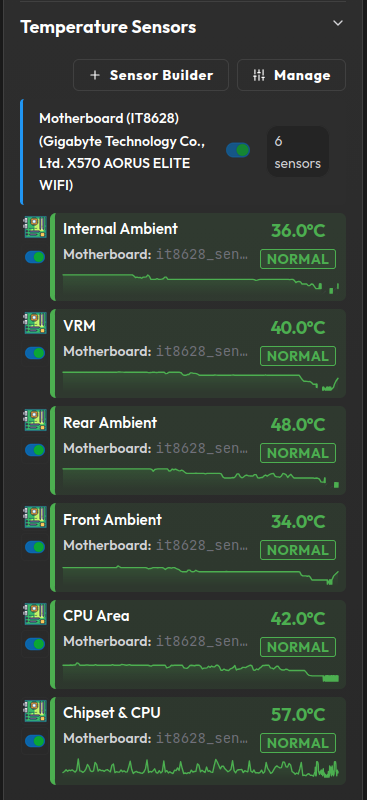
Each group header has a visibility toggle (hide a whole chip’s sensors at once) and a count. Each sensor row shows:
- A hardware-type icon (CPU, GPU, storage, motherboard, and so on) and its own visibility toggle.
- The sensor name - click it to rename; the hardware ID underneath never changes.
- The current temperature with a status badge (NORMAL / CAUTION / WARNING / CRITICAL, boundaries set by your thresholds in Settings).
- A sparkline of recent history - the time window is the Graph Scale setting.
Hiding matters: a hidden sensor is not just cosmetic - it is excluded from the card’s Avg/Peak stats and from the “Highest” control-sensor calculation. Hiding a noisy, irrelevant sensor is the right way to stop it driving your fans (Fan Profiles & Logic).
Above the list are two buttons: Sensor Builder (create a virtual sensor, below) and Manage (the sensor management modal, below).
Expanding the Fans section lists every fan:
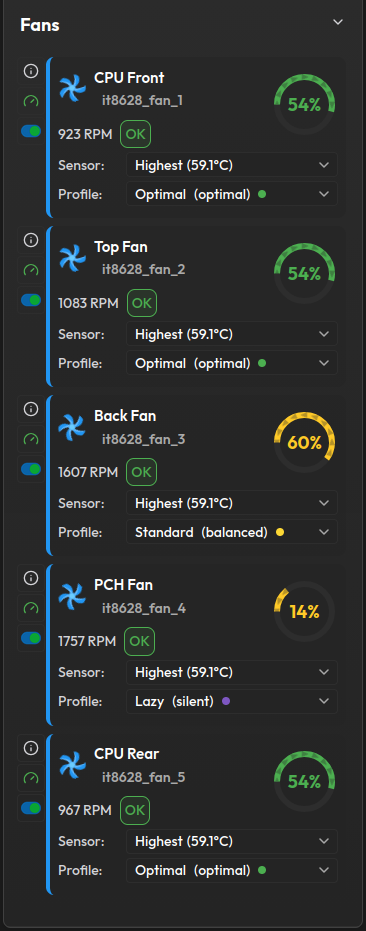
Each fan row shows:
- Three rack icons: info (opens the fan’s health and calibration panel - see Fan Calibration & Health), calibrate (starts or re-runs calibration; its tooltip tells you the current calibration state), and visibility.
- The fan name (click to rename), a spinning fan icon animated at the real speed, and the live RPM.
- Exactly one status badge, the most urgent that applies: Calibrating (controls locked until done), Stalled (commanded to spin but reporting 0 RPM), a health flag (Attention or Check fan - click the info icon for details), or the plain agent status.
- A circular speed gauge showing the commanded speed percentage; the small arrows around it drift in the direction the speed is moving.
Under each fan are its two controls - together they define the fan’s behavior:
- Sensor: the control sensor whose temperature drives this fan - an individual sensor, a sensor group, a virtual sensor, or Highest.
- Profile: the fan curve. The list is ordered No Profile (Manual), then the built-in System profiles, then your User profiles. Choosing No Profile (Manual) means Pankha stops driving the fan.
Both dropdowns are searchable. See Fan Profiles & Logic for how the curve, hysteresis, and stepping actually work.
IPMI agents show this section as Fan Zones: fans are grouped into the zones their BMC controls, the rows are informational, and the Sensor/Profile controls apply to the whole zone (the BMC cannot address zone members individually). IPMI cards also have a BMC section where the vendor profile is assigned.
Managing Sensors
Section titled “Managing Sensors”The Manage button opens a single modal for all sensor housekeeping:
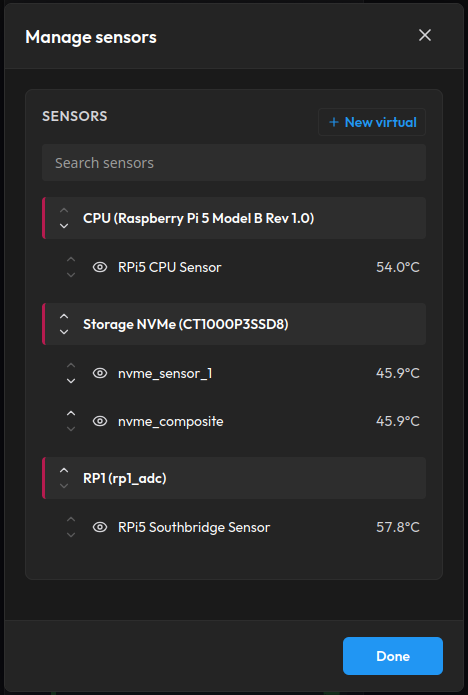
- Rename any sensor by clicking its name.
- Hide / show sensors with the eye icons.
- Reorder with the up/down arrows - sensors within a group, and whole groups relative to each other (the Virtual Sensors group moves like any other). The dashboard card follows this order.
- Search to find a sensor on busy systems (reordering pauses while a search filter is active).
- New virtual opens the Sensor Builder.
Virtual Sensors
Section titled “Virtual Sensors”A virtual sensor combines several real sensors into one reading - for example “the hottest of my four NVMe drives” or “the average of all intake-side sensors” - which you can then use as a fan’s control sensor like any other.
The Sensor Builder creates one:
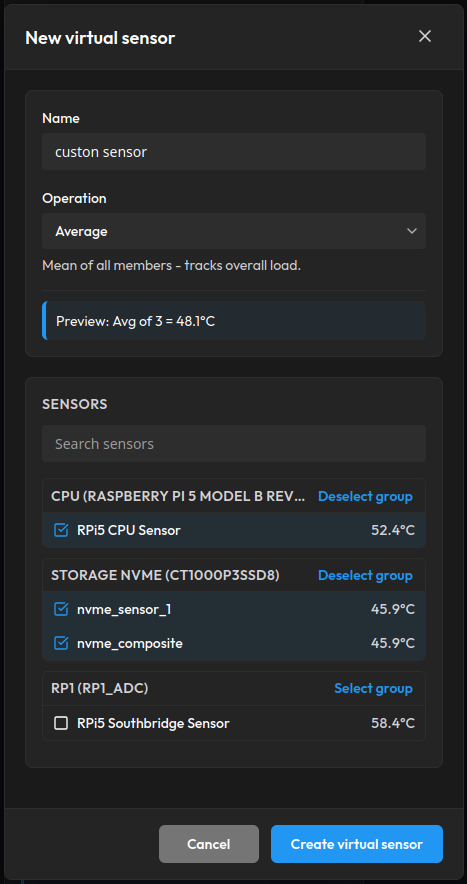
- Name it (e.g. “Intake group”).
- Pick the operation - how the members combine into one temperature:
- Max / Highest (default): the hottest member - reacts to the worst hotspot.
- Average: the mean of all members - tracks overall load.
- Middle: the middle reading - ignores one odd sensor that Max or Average would chase.
- Select at least two member sensors - search, tick individually, or select a whole chip group at once. A live preview shows the combined value as you pick.
Virtual sensors appear on the card as their own Virtual Sensors group and behave like real ones: rename, hide, reorder, and assign as a control sensor. Members must be real sensors - a virtual sensor cannot contain another virtual sensor.
Deleting a virtual sensor warns you if any fans are using it as their control sensor; those fans fall back to having no control sensor, so reassign them afterwards.
Next Steps
Section titled “Next Steps”- Fan Profiles & Logic: curves, control sensors, and bulk editing in depth.
- Fan Calibration & Health: what the calibrate icon and health badges mean.
- Advanced Settings: the per-agent configuration controls on each card.
- Settings: graph scale, temperature thresholds, appearance, and server-side options.