Quick Start
This page takes you from nothing installed to fans under automatic control, in five steps. Pankha Fan Control has two halves: a central server (dashboard + control logic, one per network) and lightweight agents (one per machine whose fans you want managed). You set everything up once, then manage it all from the dashboard.
Each step below links to a page with the full details - come back here if you go deep.
Before You Start
Section titled “Before You Start”- A machine to host the server, with Docker and Docker Compose installed.
- At least one machine whose fans you want to control - it can be the same machine.
- The machines need to reach each other over the network.
Step 1: Start the Server
Section titled “Step 1: Start the Server”On your server machine, download the release configuration:
mkdir pankha && cd pankhawget https://github.com/Anexgohan/pankha/releases/latest/download/compose.ymlwget https://github.com/Anexgohan/pankha/releases/latest/download/example.env -O .envThen open .env in an editor - the top section is marked REQUIRED CONFIGURATION and needs your values before the first start:
PANKHA_HUB_IP: this server’s LAN IP or hostname (e.g.192.168.1.100). Agents are pointed at this address, so the placeholder value will not work.POSTGRES_USER/POSTGRES_PASSWORD: pick your own database credentials.TIMEZONE(optional): uncomment and set it so dashboard times and logs match your clock.
Now start it:
docker compose pull && docker compose up -dThat’s the whole install - two containers (app + PostgreSQL). See Server Installation for the full configuration reference and custom ports.
Step 2: Open the Dashboard
Section titled “Step 2: Open the Dashboard”Browse to http://<server-ip>:3143 - port 3143 is the default; if you set PANKHA_PORT in .env, use that instead.
On first start, Pankha asks you to create the admin account - pick a username and password, then you’re signed in. Every later visit starts at the login screen. (More accounts and roles can be added in Settings → Accounts.)
Since no agents are connected yet, the dashboard greets you with a shortcut card pointing to the Deployment Center - that’s your next stop.
Step 3: Deploy Your First Agent
Section titled “Step 3: Deploy Your First Agent”In the Deployment tab, work through the numbered steps: pick the platform and architecture, stage the latest release on your server, and set the connection. The summary panel on the right then holds a one-line install command - copy it and run it on the target machine as root (or with sudo):
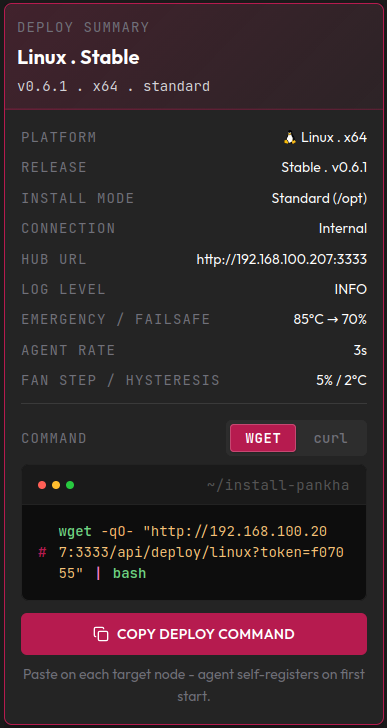
The command installs the agent as a service and connects it to your server - it appears on the dashboard within seconds. For Windows, the summary offers an MSI installer instead: run it on the Windows machine, then enter your server’s address in the tray app.
Full details: Deployment Center, Linux Agent, Windows Agent, IPMI Agent.
Step 4: Give a Fan a Profile
Section titled “Step 4: Give a Fan a Profile”Your new system appears as a card on the Dashboard. Expand its Fans section - each fan row has two dropdowns, and together they define the fan’s behavior:
- Fan Profile: the temperature-to-speed curve. Standard or Optimal are good first picks.
- Control Sensor: the temperature that drives the curve. Highest is the safe default - the fan responds to whatever is hottest on that machine.
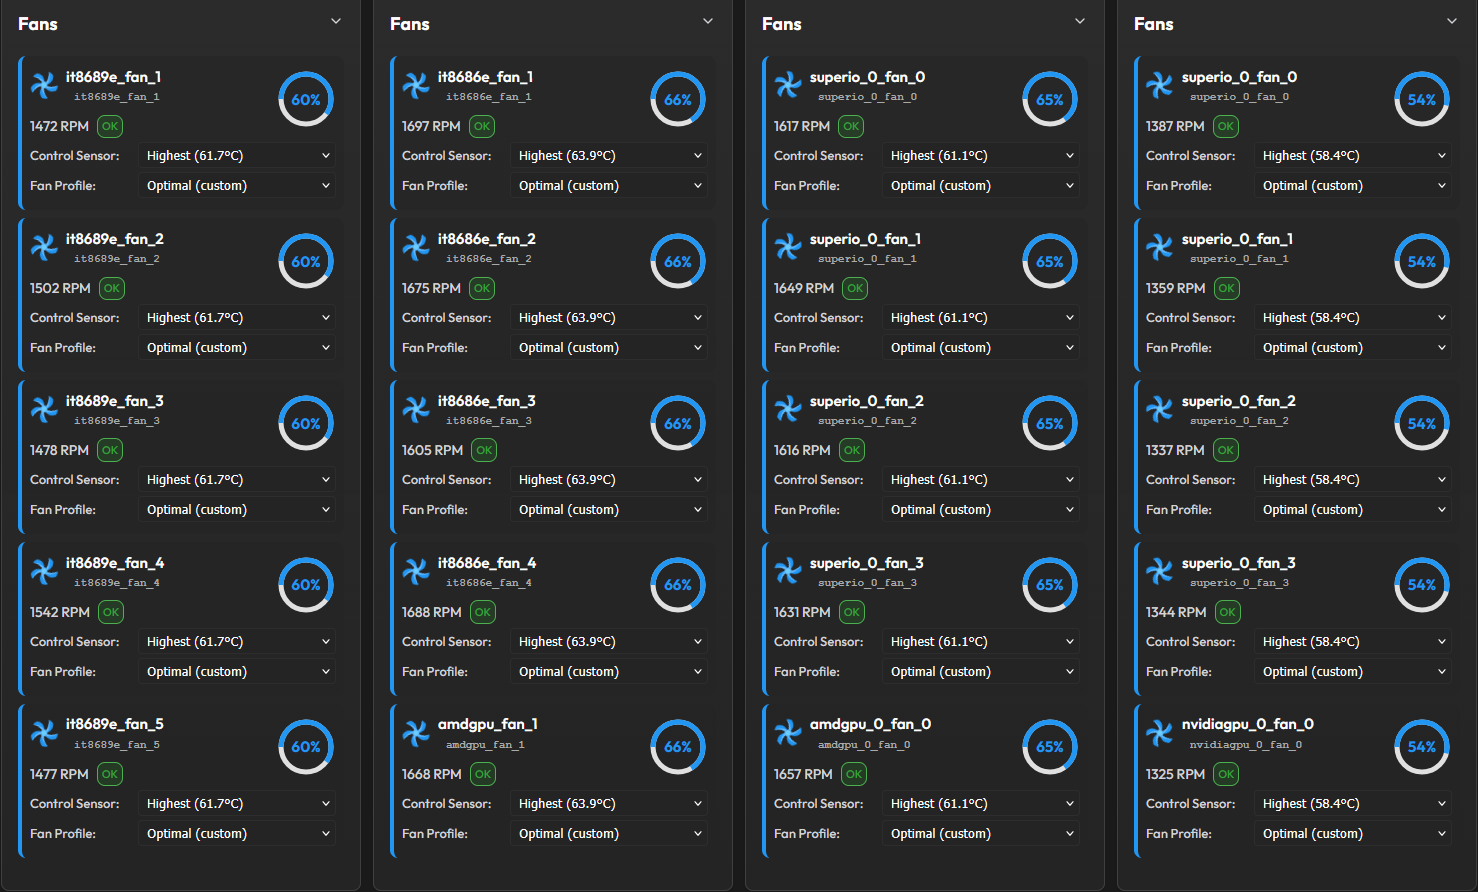
Got many fans? Bulk Edit on the system card applies a profile and sensor to several fans in one action. See Fan Profiles & Logic for the built-in profiles, sensor groups, and custom curves.
Step 5: Watch It Respond
Section titled “Step 5: Watch It Respond”That’s it - the fan is now under automatic control. Each row shows the live speed percentage and RPM; put some load on the machine and watch the speed follow the temperature up the curve, moving in smooth steps rather than jumps.
From here on, everything about the agent - settings, calibration, updates - is managed from this dashboard. You shouldn’t need to touch the agent machine again (Agent Philosophy).
Where to Go Next
Section titled “Where to Go Next”- Deployment Center: deploy agents to the rest of your machines.
- Advanced Settings: tune update rate, hysteresis, fan step, and safety thresholds.
- Fan Calibration: measure each fan’s real usable speed range.
- Troubleshooting: if an agent doesn’t appear or a fan doesn’t respond.